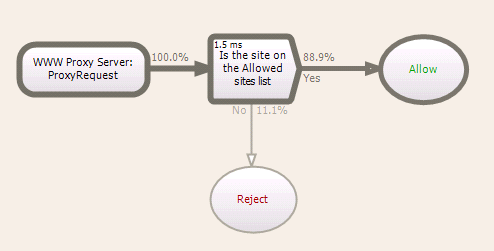
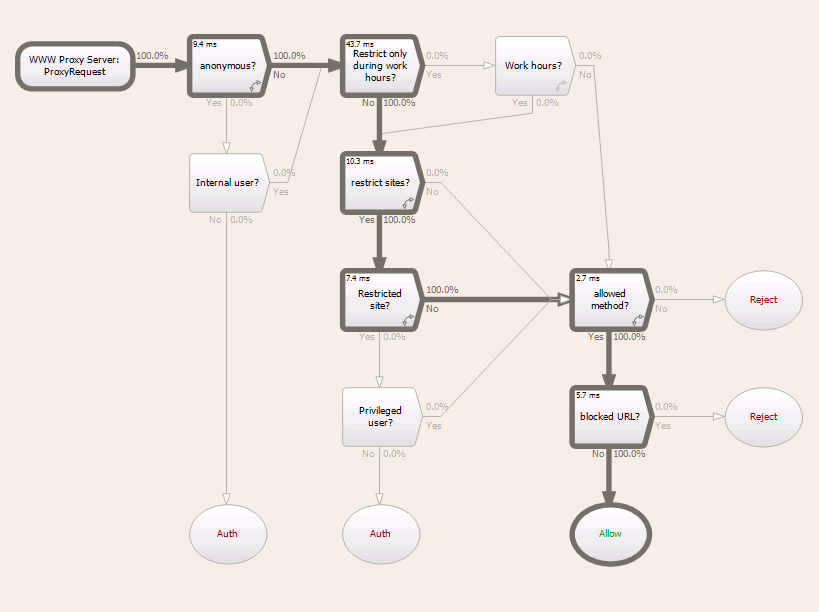
The Policy system allows you to monitor and adjust the performance of each policy. This helps to ensure that whenever it is evaluated, the policy is performing effectively and using the computers resources as efficiently as possible. It does this by providing the current processing statistics for each policy item, as well as displaying the most common paths taken by the policy evaluation.

Every time a particular decision type policy item is processed as part of the policy evaluation, the statistics for a YES or NO answer are shown as a percentage on each relevant YES or NO output arrow. This can be extremely useful in seeing the most common outcome for each decision that is processed. These statistics allow you to fine tune the structure of the policy so that you can implement the most effective types of decisions and actions when the chosen event occurs.
Hovering over a particular policy item will display a small dialog containing the name and type of the policy item, and the amount of hits it currently has received through previous evaluations of the policy.
To allow for easy monitoring of the policy processing, the most common path traveled in policy evaluation will appear more thicker then the arrows on the less frequently traveled paths. This common path allows you to see at a glance common processing behaviors and the overall effectiveness of the actual policy.

Each decision type policy item in the flow chart will display the amount time it took to process the most recent evaluation. This is measured in Milli and Pica seconds.
The statistics will be displayed on the worksheet flow chart whenever you open a policy in the policy editor. You can display or hide the statistics of the policy on the worksheet at any stage by clicking the Statistics button in the menu ribbon at the top of the Policy editor.
The current statistics will also appear in the Preview pane of the particular policy when selected in the the Policy panel.
A summary of the current statistics for each policy is displayed in the Statistics tab in the policy editor.
The Statistics tab summary allows you to see the total time spent in the policy (the last time the event occurred) and an average time of processing each policy item.
Whenever you view the statistics for a policy, the statistics displayed on the policy items on the policy editor worksheet will be from all the times that policy has been evaluated, up until you opened the policy.
To refresh the view of policy statistics to the most current state, either select Refresh from the menu ribbon when viewing the policy inside the Policy editor. Or right click Refresh from the context menu on the Policy preview pane when you are viewing the main Policy panel.
©2012 Qbik New Zealand Limited
no comments yet...
You can use basic Full-Text Searches against the page title and body to find matching articles. Use the following search modifiers to refine your query:
You can create a new account or reset your password at forum.wingate.com.
